Overview The GeneList tool allows the user to search for genes using gene IDs, descriptions, experiments, GO ids and different annotations, and then saves the result in a list that can be used by other tools.

Basic Usage

[video width="1600" height="900" mp4="https://help.plantgenie.org/wp-content/uploads/genelist_final.mp4"][/video]

Simply type in gene ids, descriptions, or different annotations. The matching genes will be displayed with selected annotations. The result can be customized by clicking the Select Displayed Annotations button. There are three buttons to “Save all to Gene List”, “Remove selected from Gene List” or “Empty Gene List”. The “Share table” button allows sharing the current GeneList with other users by way of an auto generated URL. The GeneList tool is the starting point for most PlantGenIE workflow.

Multiple GeneList The GeneList tool is capable of holding several named gene lists for use in other tools. These lists can be Added, Renamed or Deleted. Once clicking on a GeneList name, it will become the active GeneList and will be displayed in all other tools. GeneLists will remain for seven days while shared GeneList will be saved for 30 days.

Data We use both PostgresSQL and MySQL to store annotation data. The GeneLists tool uses both in house annotation data and data from Phytozome and Plaza.

Implementation This tool uses JavaScript, PHP, MySQL, PostgreSQL, JQuery, Datatables and Toastr libraries. SQL views and tmp tables gave additional speed to the tool.


Overview The BLAST (Basic Local Alignment Search Tool) tool compares input sequences to PlantGenIE sequence databases to identify homologous sequence matches.

Basic Usage Simply paste your sequence (with or without a FASTA header) into the Query Sequence input text box. Alternative you can retrieve a transcript sequence by entering a gene ID into the Load example text box, or you can upload a sequence file (Less than 100 MB) using the upload file function. Having used one of these input options, click and select the desired dataset from the lists of available BLAST databases. Finally click the BLAST! button at the bottom of the page.

PlantGenIE BLAST uses standard default NCBI BLAST options. However users can change the following advanced options:

Option Description
Scoring matrix Substitution matrix that determines the cost of each possible residue mismatch between query and target sequence. See BLAST substitution matrices for more information.
Filtering Whether to remove low complexity regions from the query sequence.
E-value cutoff The maximum expectation value of retained alignments.
Query genetic code Genetic code to be used in blastx translation of the query.
DB genetic code Genetic code to be used in blastx translation of the datasets.
Frame shift penalty Out-of-frame gapping (blastx, tblastn only) [Integer] default = 0.
Number of results The maximum number of results to return.

BLAST results The BLAST Results page will be automatically reloaded until the search results are successfully retrieved. BLAST results are organized into a table containing Query ID, Hit ID, Average bit score (top), Average e-value (lowest), Average identity (av. similarity) and Links. Clickable BLAST results display the corresponding region of identified homology within the JBrowse tool, where the matching region is shown.

Data The BLAST tool uses public genome assemblies, early release de novo assemblies from UPSC and data from [Phytozome] (http://www.phytozome.net/) and Plaza.

Implementation PlantGenIE BLAST search is implemented using NCBI Blast (v2.2.26) and a backend PostgresSQL Chado database. We use PHP, JavaScript, XSL, Perl and d3js, Drupal libraries to improve Open Source GMOD Bioinformatic Software Bench server to provide a graphical user interface.


Overview exImage provides an intuitive pictographic view of expression data across a diverge range of PlantGenIE datasets.

Basic Usage Users can either enter a gene ID in the input text area (and hit the "GO" button) or create a gene list which then will appear as an interactive list in the tool. exImage will shade the samples according to expression levels across multiple samples using either absolute or relative values. Relative values displays expression relative to the mean expression across all samples. The current view can be exported in various vector formats including publication ready PDFs or as expression values. The ‘Take a tour’ feature will provide a brief introduction to the basic functionalities in exImage.

Data exImage uses TPM (Transcripts Per Kilobase Million) values for absolute expression, and no unit for the relative values. Absolute expression values were generated by aligning RNA-Seq reads to the reference genome and gene annotation with aligned read numbers then used to calculate TPM values.

Implementation exImage was developed using PHP, Javascript, d3js, rsvg-convert, imagemacgick, librvg and batik. exImage uses a MySQL database as a backend data source. exImage was inspired by the eFP resource.


Overview

exPlot is an interactive plotting tool visualize expression profiles as line graphs for selected genes and experiments.

Basic Usage

Type in multiple gene IDs in the input text area separated by comma, space, tab or new line and hit the "Search" button. Alternatively, you can create a gene list, in which case genes from the currently active list will be displayed. The tool plots VST normalized gene expression values across the selected samples or pre-defined sets of samples for the input genes. Different sample sets are available in the ‘SampleList’ in the top-right corner of the page. The plot is interactive and allows the user to select a subset of the displayed genes and to create a new GeneList containing only these genes. Publication-ready figures, in PDF or SVG format, can be exported

The ‘Take a tour’ feature will provide a brief introduction to the basic functionalities available in exPlot.

Data

exPlot uses TPM (Transcripts Per Kilobase Million) values for absolute expression. Absolute expression values were generated by aligning RNA-Seq reads to the reference genome and gene annotation with aligned read numbers then used to calculate TPM values.

Implementation

exPlot was developed using JavaScript, PHP and MySQL. It uses Highchart open source framework to visualize, draw and export charts interactively.

Overview The Chromosome diagram tool plots the location of genes in the active gene list.

Basic Usage Type in multiple gene ids inside the input text area separated by comma, space, tab or new line and hit the "Submit" button. Click the padlock icon to enable zoom in function. You can scroll or use the zoom slider to zoom in or zoom out the chromosome diagram. When you mouse over the gene location, it will show the detailed information popup and link to the Gene Information page. You can simply drag and select the favorite gene locations and export as TSV or GFF3; or visualize in Phytozome or Agrigo. The Chromosome diagram tool allows users to upload a gene list and display the chromosomal location of those genes. It has controllers to change the color of the output diagram and also generates publication-ready plot that can be exported in common file formats including PDF.

Data The Chromosome diagram tool uses basic annotation data from PlantGenIE MySQL database and you can upload custom files.

Implementation The Chromosome diagram tool was built using Action script, PHP and MySQL.

eXHeatmap
This tool is generates a heatmap plot, useful for clustering and for analyzing the expression of genes relative to each other. The network analysis tool (Popnet) is a useful alternative to clustering, while the expression plotting tool (exPlot) can be a useful alternative for plotting expression profiles. This tool uses the current gene list and sample list available in the Master Menu, so if those lists are empty, users must first fill them up from a set of dedicated tools.

Clustering with the heatmap
The genes are clustered based on the choice of a distance function and the result of the clustering is shown by means of a dendogram, that can be places on either of x and y axes. The color scale indicates how far the actual expression values are from the local consensus. Distance functions are quantifying how similar is the expression of two genes/samples. For more accurate estimators of gene expression similarity use the PopNet tool. Based on the all-pair distance estimations the genes are clustered together using a chosen variety of the hierarchical clustering algorithm. The sample information is selectable from the command panel. By clicking on the heatmap itself you will open a publishing-ready pdf, or you can export the heatmap data from the command panel and import it into your favorite plotting program.

Overview

exNet (expression Network) is an interactive tool for exploring co-expression networks.

Basic Usage

exNet visualizes co-expression between genes in the active gene list. Co-expression is visualized by drawing a co-expression network where genes are displayed as nodes and co-expression between genes is indicated by connecting nodes with an edge (i.e. if two genes have a line connecting them, they are co-expressed above the selected threshold).

exNet display panel

The various elements of the exNet interface are shown Figure 1 and will be explained in detail. To view a network, exNet requires an active list of genes selected using the gene list tool. The network display shows an editable co-expression network of the current gene selection and allows various operations. Some of these operations are available by selecting genes and right clicking on the selection to access the selection menu. The actual network being displayed is controlled from the display settings panel. Various plots can be interactively displayed as the user selects network elements, and can be opened in their own specialised tools.

[gallery size="large" columns="1" ids="685"]

Figure 1. ExNet

Implementation exNet uses Cytoscape Web (Flash) as the core for the network layout and visualization; the web page is coded in HTML, JavaScript and PHP. For structuring and printing the network information, a python script is used. The data is stored in a MySQL database and PHP mysql and Python MySQLdb packages are used to access the data.  

Enrichment Treemap

Results table

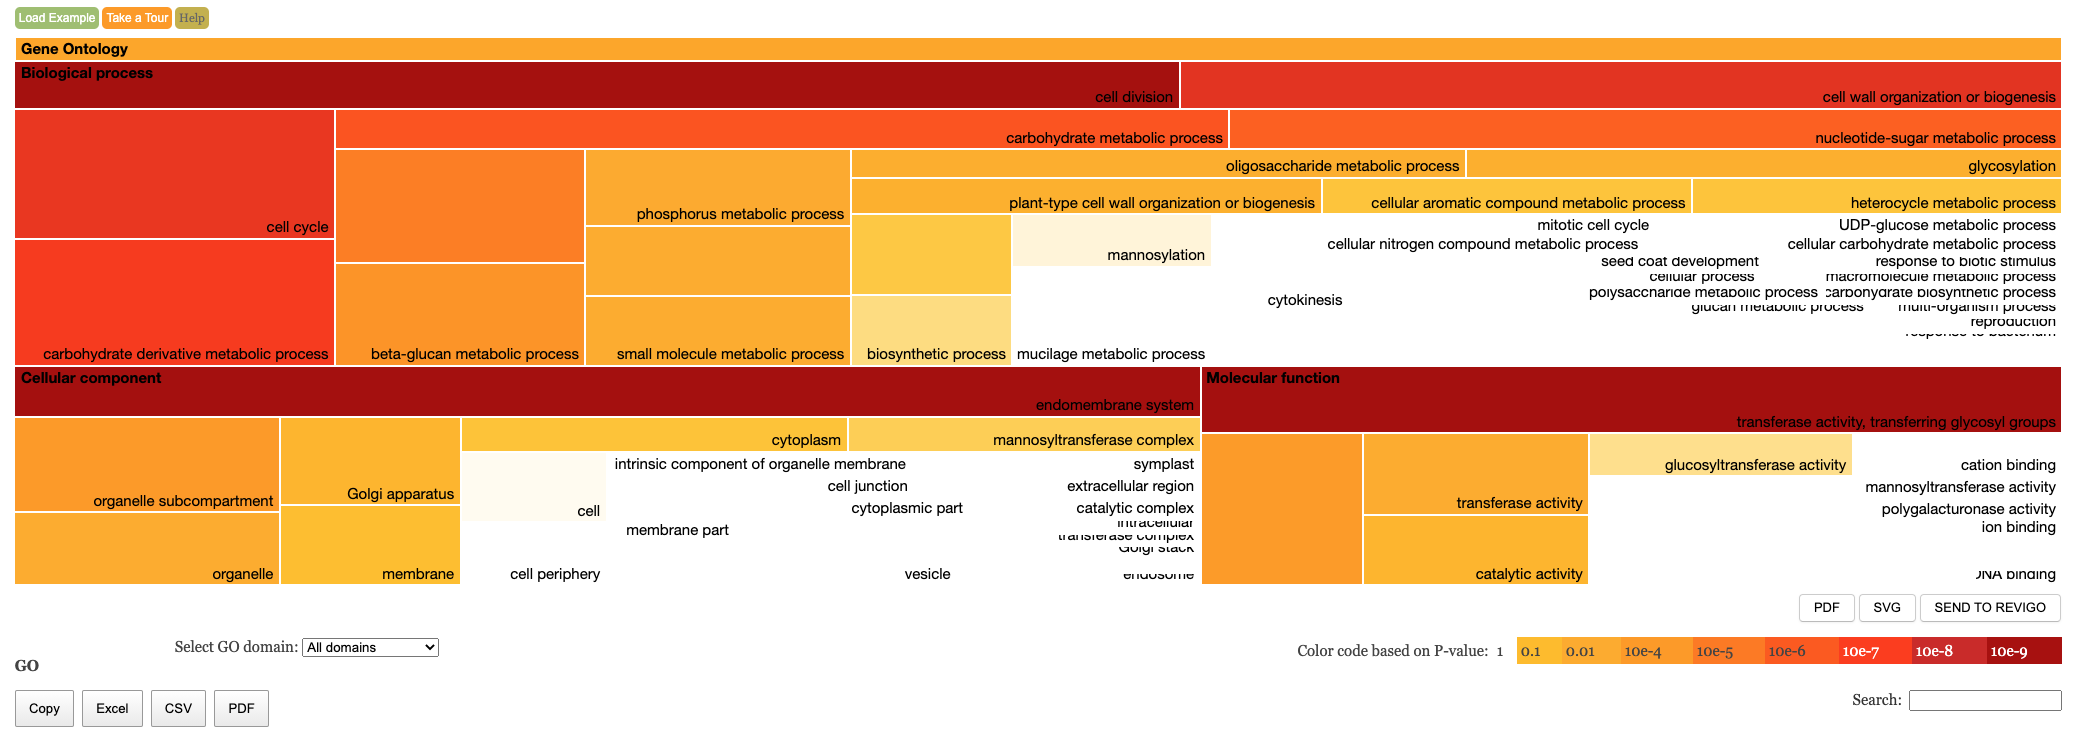
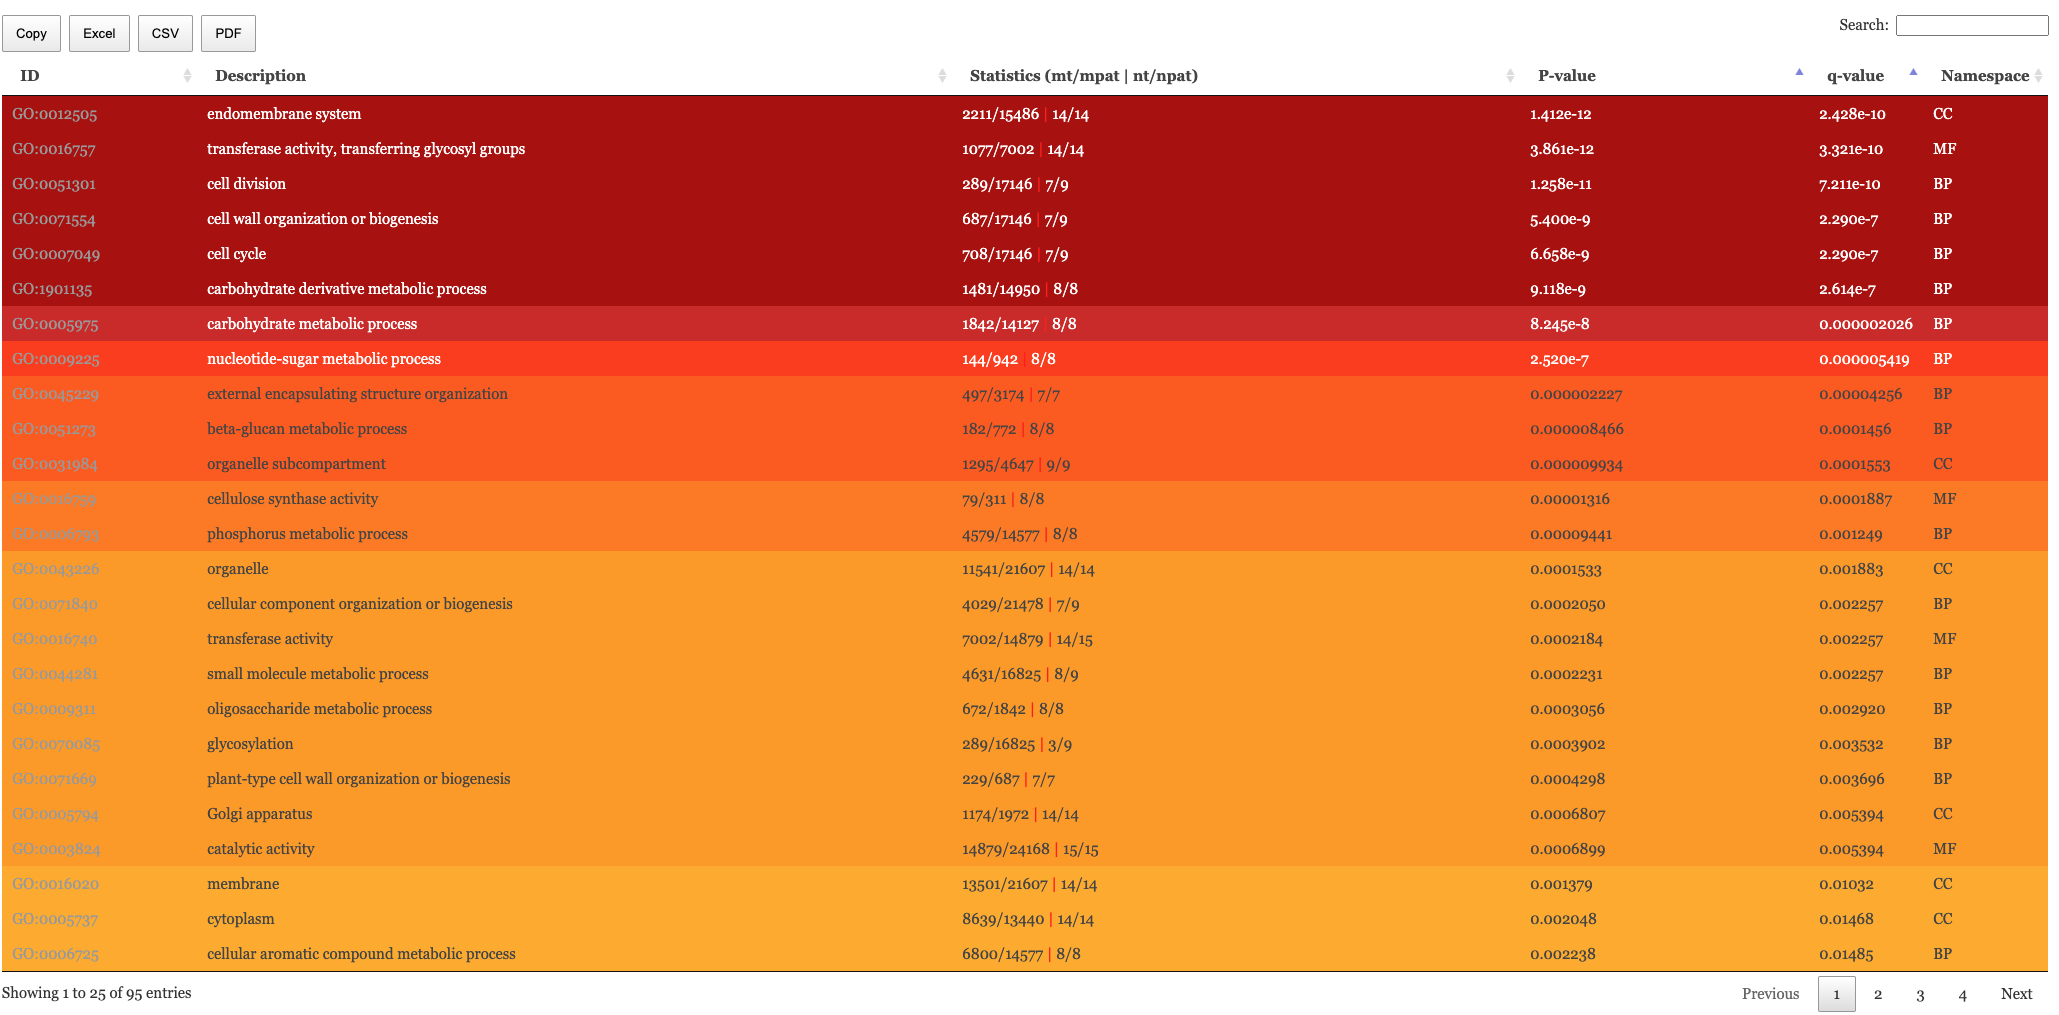
The table of results and tree map figure are colour coded to indicate statistical significance. Red means highly significant and white means less significant. We have the following columns in the Enrichment results.

  • mt: The number of genes in the entire population annotated to this term
  • nt: The number of genes in the test set annotated to this term
  • mpat (Only "go" and "hierarchical"): The number of genes annotated to this term or parents of it in the entire population
  • npat (Only "go" and "hierarchical"): The number of genes annotated to this term or parents of it in the test set
  • pval: The naive p-value
  • padj: The p-value adjusted for multiple testing correction (pval -> padj) is Benjamini-Hochberg.

*PlantGeniE uses GO test for GO enrichment and Fisher exact test for PFAM and KEGG. Fisher's Exact Test (By default) : https://github.com/brentp/fishers_exact_test  GO: https://academic.oup.com/bioinformatics/article/23/22/3024/208216

For more details https://github.com/bschiffthaler/gofer2

Best tips to try before you contact us!

The recommended web browsers are Google Chrome or Mozilla Firefox. We have found that many apparent problems with tools in PlantGenIE can result from previous results that have been cached. If you run into problems at the site first try reloading/refreshing the web page, try using an incognito browser in Google Chrome or private window in Mozilla Firefox.Before reporting a bug/problem we would request that you first clear your browser cache, quit the browser, again clear the web browser cache when you re-open the browser and then finally check that the problems remains.

How can I find PopGenIE old versions? https://popgenie.org https://congenie.org https://atgenie.org http://v2.popgenie.org http://v1.popgenie.org

How can I convert Populus trichocarpa version 1 gene ids into version 2 gene ids? Please go to http://v2.popgenie.org/flashbulktools (depreciated due to End of Life of Adobe Flash Player) and choose the ID conversion option. Then select the Populus Genome from dropd down menu. Finally paste your old gene ids and click GO button.

How can I convert Populus trichocarpa version 2 gene ids into version 3 gene ids? Please go to Gene Search tool and paste your old gene ids.

Are regulatory regions available for the predicted genes? Here you can find the detailed answer for this question.

Can not access FTP server?
If Google Chrome is your default web browser, please try the following steps before you directly access FTP site.

1.) Go to PlantGenIE FTP ftp://anonymous@plantgenie.org/
2.) Open the link with associated application (e.g. Finder on Mac or Windows Explorer on Windows)
3.) Connect as a guest user and Click Connect button


[gallery columns="2" size="large" ids="715,714"]

Overview The Gene information page contains basic information about a gene including sequence, function and family information.

Basic Usage The Gene Information Page consists of dedicated tabs names: Basic Information (including GBrowse details), Sequence, Functional Information, Expression Overview, Gene Family and Publications (including community annotations). The Basic tab gives a quick overview (Chromosome, Description, Synonyms, and best Diamond hits) of the gene or the gene model. The Sequence tab contains Genomic-, CDS-, Transcript- and Protein- sequences. You can easily BLAST any of the above sequences by clicking the related BLAST button, and you can extract Upstream or Downstream Genomic sequence by adjusting the upstream/downstream input boxes. 5’ UTR, CDS, 3’ UTR regions are highlighted with dedicated colors. The Functional information tab includes annotations from different data sources including GO, PFAM, PANTHER, KO, EC and KOG. The Expression Overview tab displays the exImage image for the gene, and gives a visual overview of the tissues where the gene is expressed. More tissues/samples are avaiable at the dedicated exImage tool. The Gene Family tab contains gene family information across several different species. You can select a species and download fasta file or create a phylogenetic tree using either Galaxy or Phylogeny.fr. You can also send a gene families to the PlantGenIE GeneList or visualize expression conservation/divergence using the ComPlEX tool. The Community Annotation tab will display the user submitted annotation of gene models. You can edit the current annotation using the WebApollo annotation editor. Once members of PlantGenIE team approved the new submission, it will display inside the Community Annotation tab.

The Gene Information page is the starting point to WebApollo and this will also be the final destination for many of the PlantGenIE tools, for example GBrowse, GeneList or exPlot. There are dedicated pages for both genes and transcripts information.

Data The Gene Page uses data from various sources including Gbrowse, exImage, WebApollo and MySQL. The GeneLists tool uses in house annotation data and data from Phytozome and Plaza.

Implementation The Gene Information page uses JavaScript, PHP, MySQL, PostgreSQL, JQuery and d3js.


here